Driving a 95% Increase in Daily Orders by Streamlining Merchant Ordering

How we found where kirana merchants were dropping off, brought savings and margins forward to the moment they decide, and tested it with merchants before build.
Merchants were dropping off at every step, and the reason to buy was hidden until checkout
JioMart Partner is a B2B app where kiranas, HoReCa, offices and institutions order in bulk, with thousands of orders a day. The data showed drop-offs growing as merchants moved through the journey: 16–29% after browsing, 10–19% at the cart and 23–43% at payment. And the thing a merchant buys for, savings and margin, stayed buried until checkout, where too much competed with the payment.
Hard to find things fast
No recent or popular searches, and no offers while searching.
Margin was invisible
Cluttered cards, and no clear bulk price or profit.
Hard to edit, unclear savings
Quantities didn't look editable, and discounts showed up too late.
Too much at the money moment
The same amount shown twice, and a new page for every detail.
Fix the ordering journey, and orders should follow
Find what hurts the ordering journey most, and fix it for a seamless flow.
Improve ROI by increasing the number of orders.
Understand merchants’ needs, pain points and usability issues.
improve the ordering journey by finding and fixing the usability issues and pain points merchants face?
We started with the merchant and the data, then designed and tested before build
Who orders, and what they care about
Runs his shop on his own and buys through the day, with evenings the busiest. He reads basic English but prefers his own language, and in a crowded market his reputation depends on keeping customers happy.
What decides a purchase
We broke the journey into four touchpoints: home and search, product listing, cart and checkout. Each got the same treatment: drop-off data, a heuristic review and a competitor review.
Each one got the same in-depth treatment: drop-off dataheuristic reviewcompetitor review
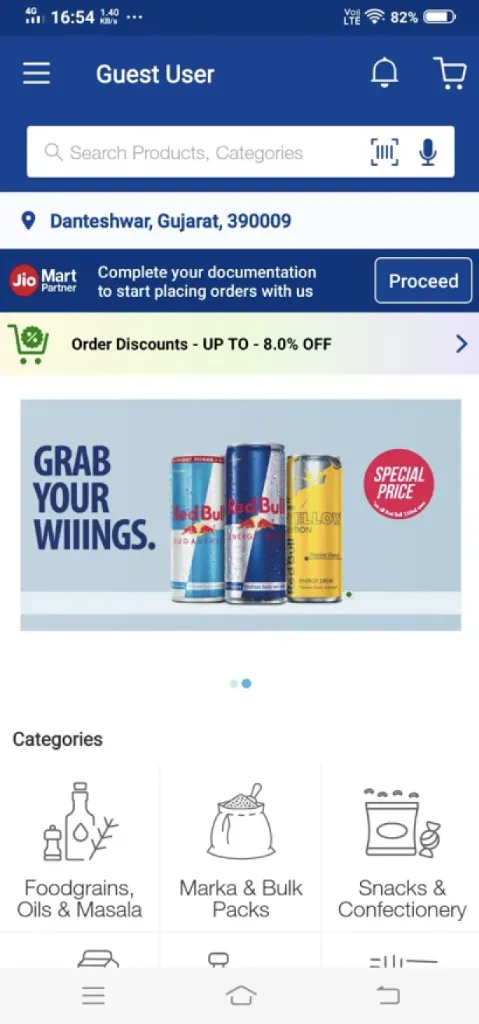
Home
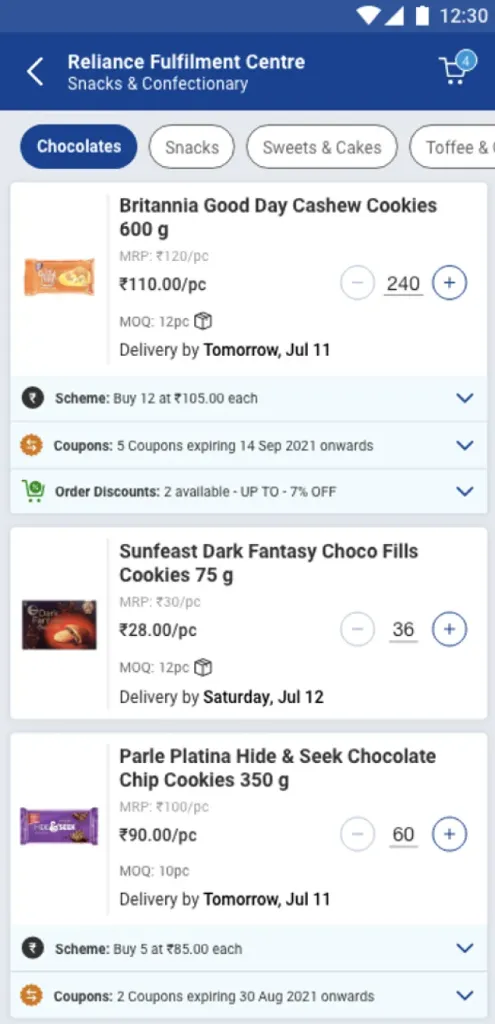
Product listing
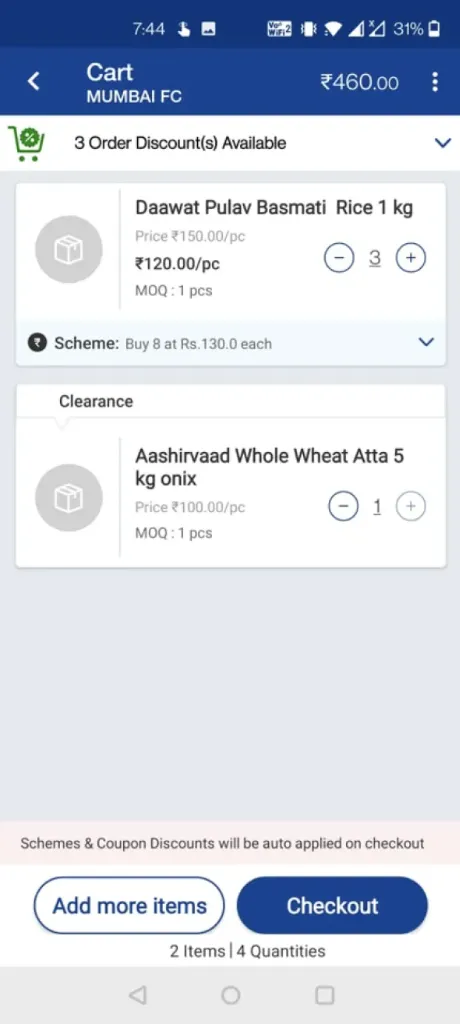
Cart
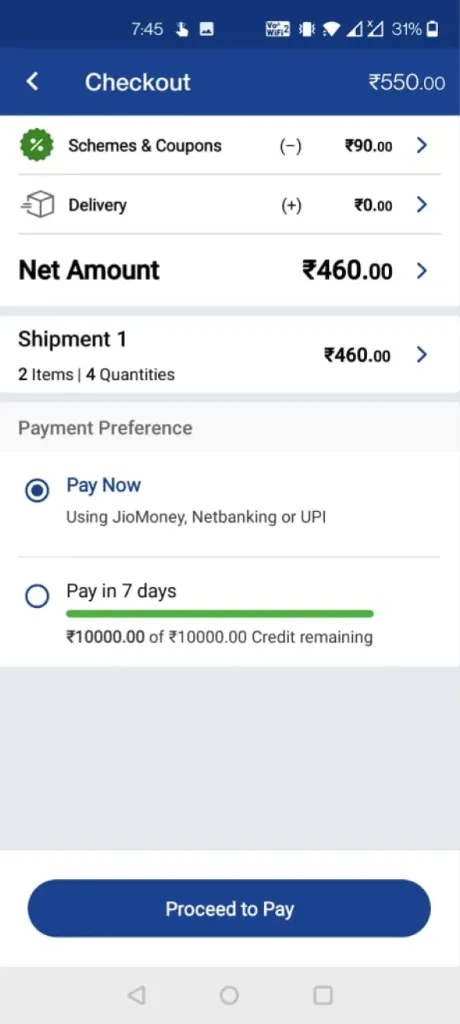
Checkout
The journey before the redesign
Daily orders were the number to move
We started with the KPIs for Q4 FY22. The one we focused on was 56,267 average daily orders, and the question was how to grow it.
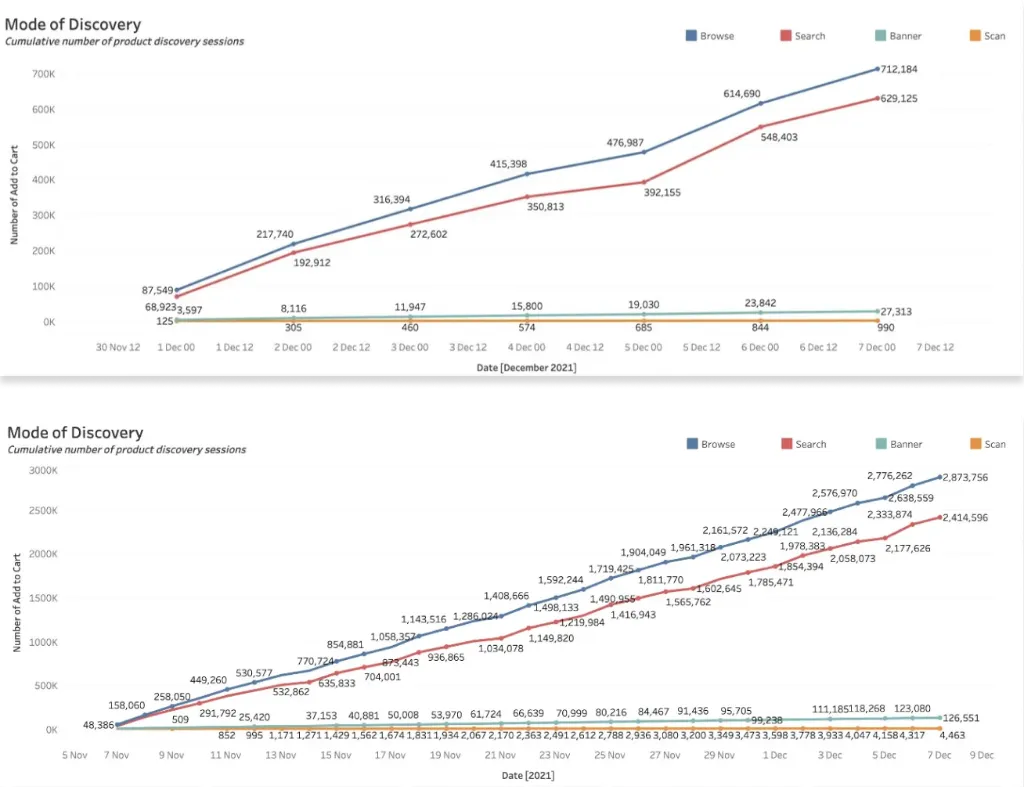
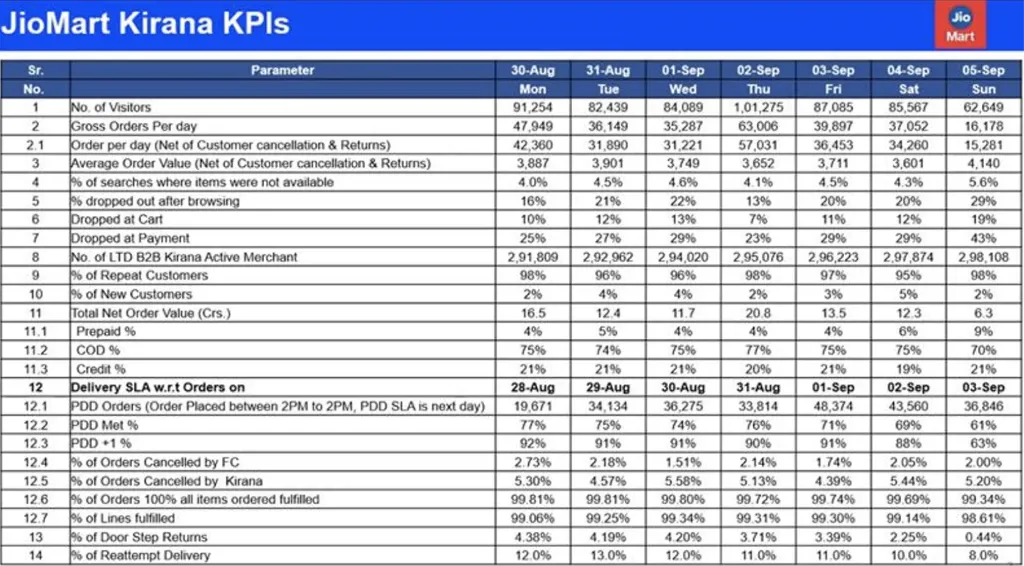
Drop-offs grew the closer merchants got to paying. Our working guesses for why:
Technical issues. Screens not responding.
No credit. Merchants who buy on credit leave when it isn't available.
Price and margin. A better price on another app.
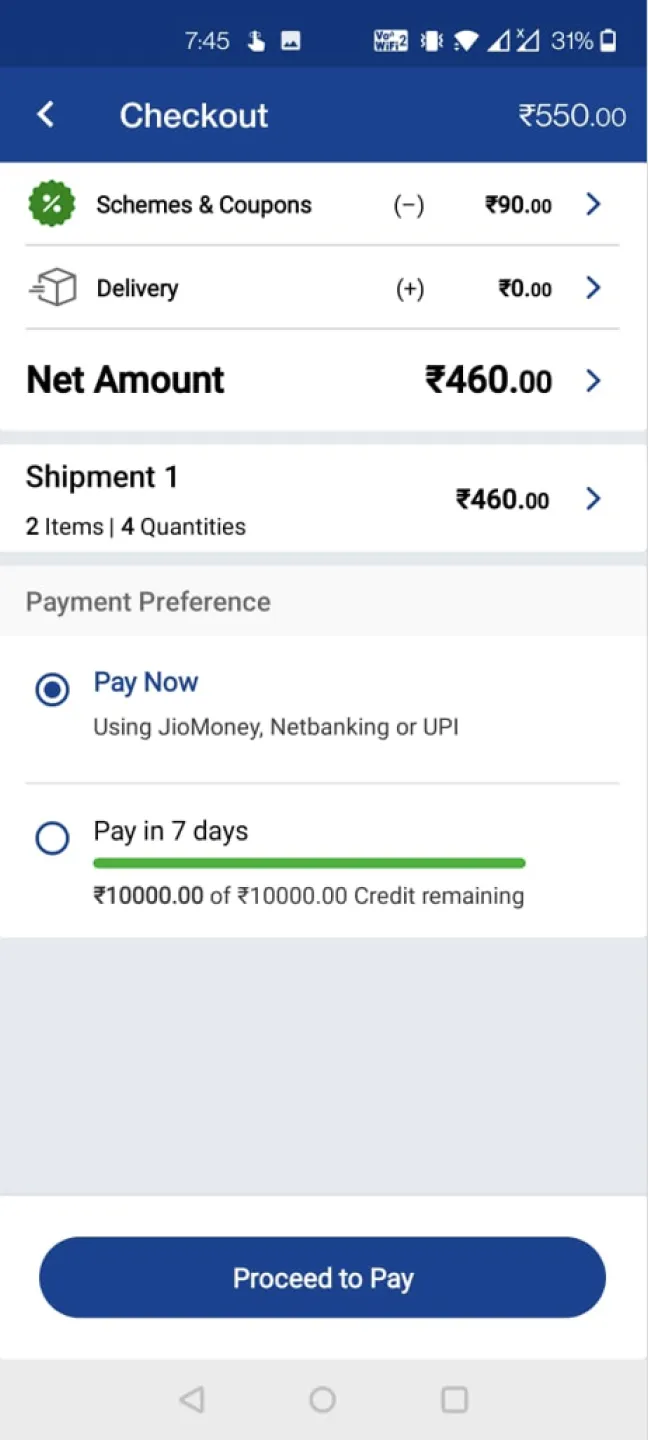
Unclear checkout. Not understanding what they're paying for.
Rigid cart. Not able to understand or change what's in it.
We checked each screen against Nielsen's 10 usability principles
Three screens, each checked against the principles. Pick a screen, then hover a highlight to see what we found.
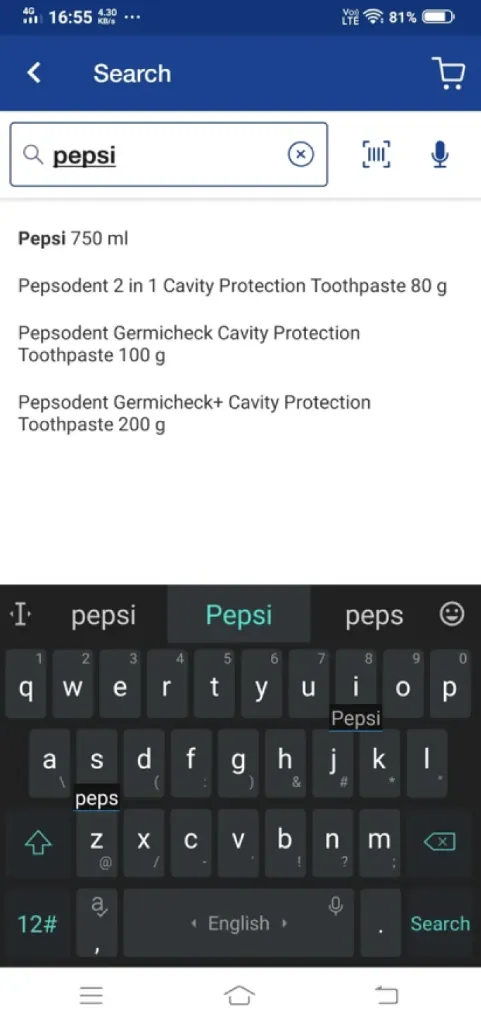 123
- 1Recent searches are not shown.
- 2No suggestions or offers.
- 3Category based search results are not reflected. Could be shown better.
Hover a highlight or a note to link them
 1121123
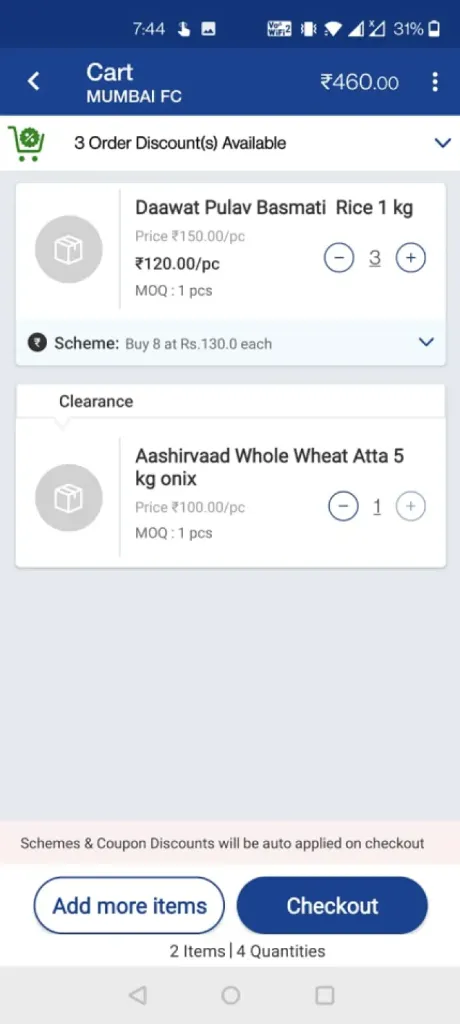
- 1The total to pay isn’t highlighted.
- 1Quantity is editable but doesn’t look it.
- 2No easy way to remove an item, like a swipe or a “Remove” button.
- 1Scheme and discount copy is unappealing.
- 1Items, quantity, price and savings aren’t clear.
- 2“Add more items” breaks the journey; it can go.
- 3Scheme and coupon savings only show after checkout. Showing them here would pull merchants forward.
Hover a highlight or a note to link them
 11234
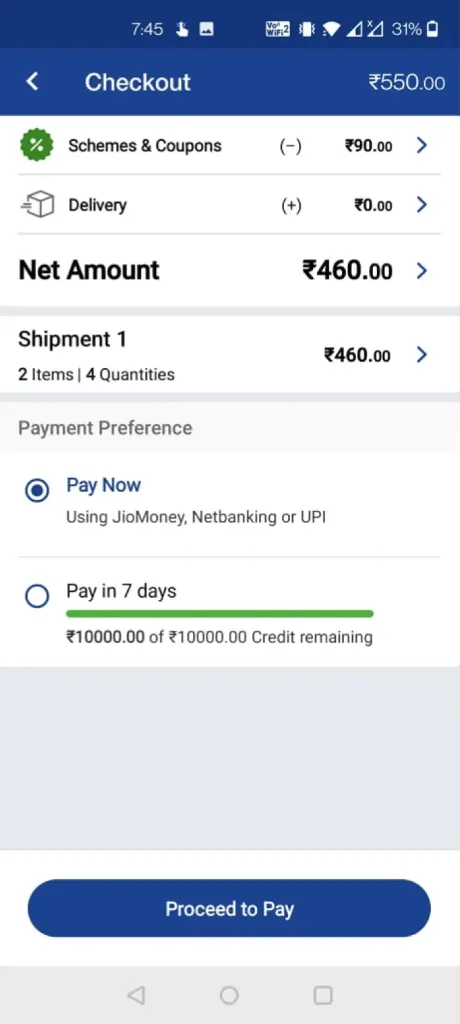
- 1Misleading: shows the total before coupons and schemes.
- 1The same amount is shown twice.
- 2Every detail opens a new page.
- 3Delivery details are missing.
- 4Visual representation needs to be improved.
Hover a highlight or a note to link them
Then we studied who merchants compare us with
A B2B benchmark and an e-grocery benchmark that serve similar users. Same structure: pick a screen, hover to see the notes, and what we took from it.
 12
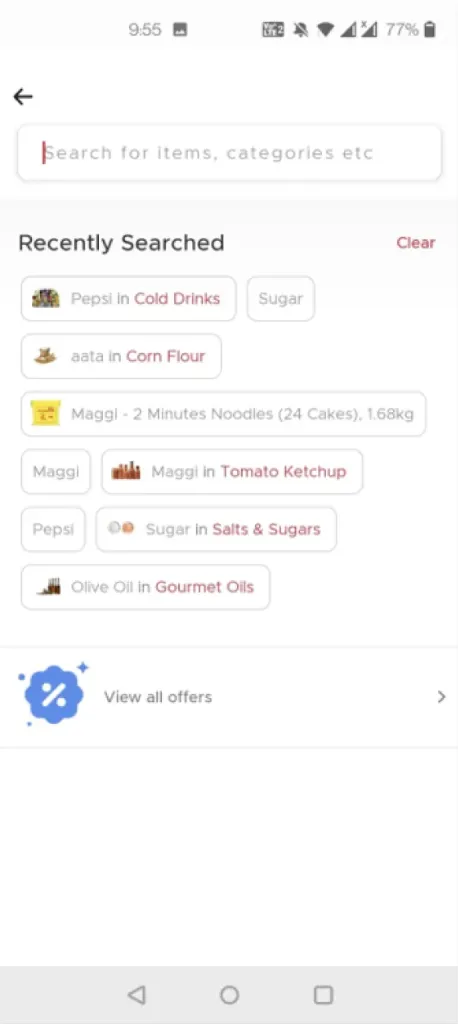
- 1Showing recent searches clearly.
- 2Showing all offers also.
Recent searches and offers, right in Search.
Hover a highlight or a note to link them
 1
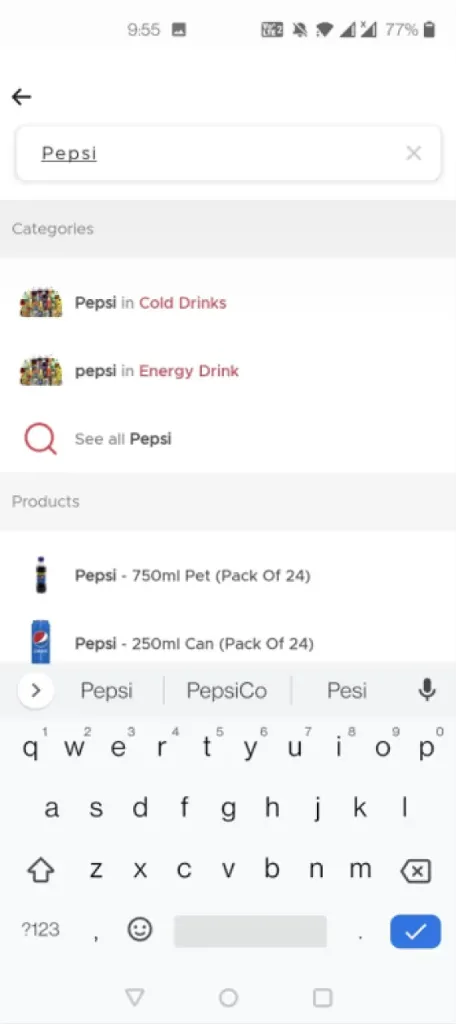
- 1Segregating search results into categories and products as well.
Results split by category and product.
Hover a highlight or a note to link them
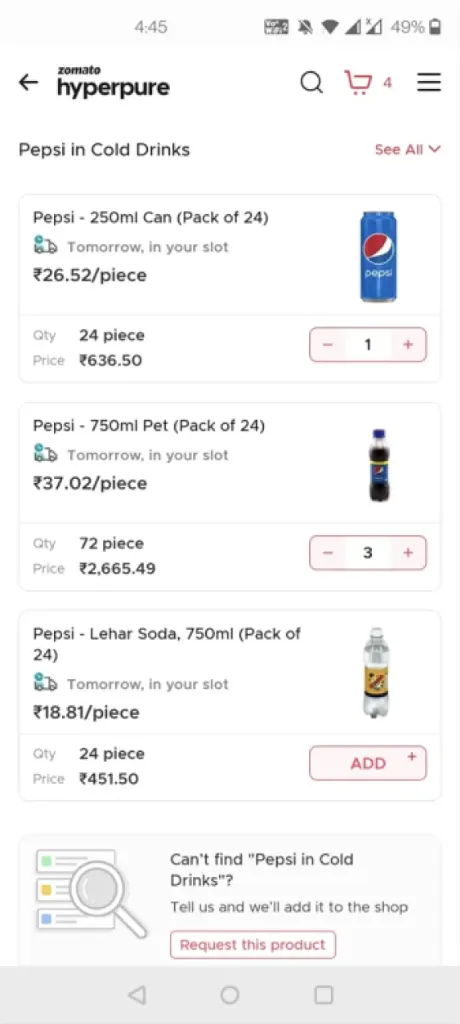 1234
- 1For the same product there are different variations.
- 2As soon as the merchant adds the product to the cart, in the PLP itself the price to be paid for that product is shown.
- 3Upfront widget for helping user find their desired product.
- 4Visual representation is clean and minimal.
The price to pay, shown on the product list; variants side by side.
Hover a highlight or a note to link them
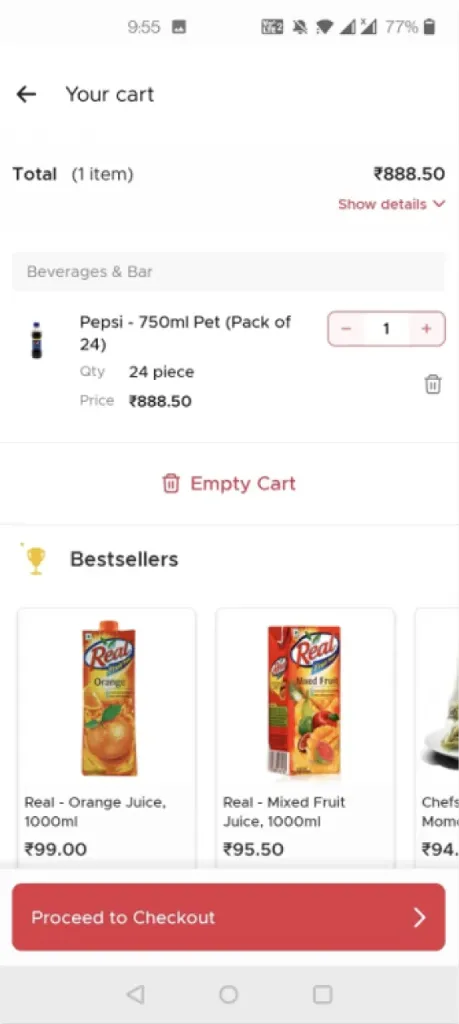 12345
- 1Clearly reflecting the amount to be paid in the cart itself.
- 2Showing bestseller recommendations as well.
- 3Easy to modify empty cart CTA and delete button.
- 4Clean and minimal visual representation.
- 5Decluttering the screen by using dropdown for representing amount breakup.
The amount to pay up front, bestsellers, and a dropdown for the breakup.
Hover a highlight or a note to link them
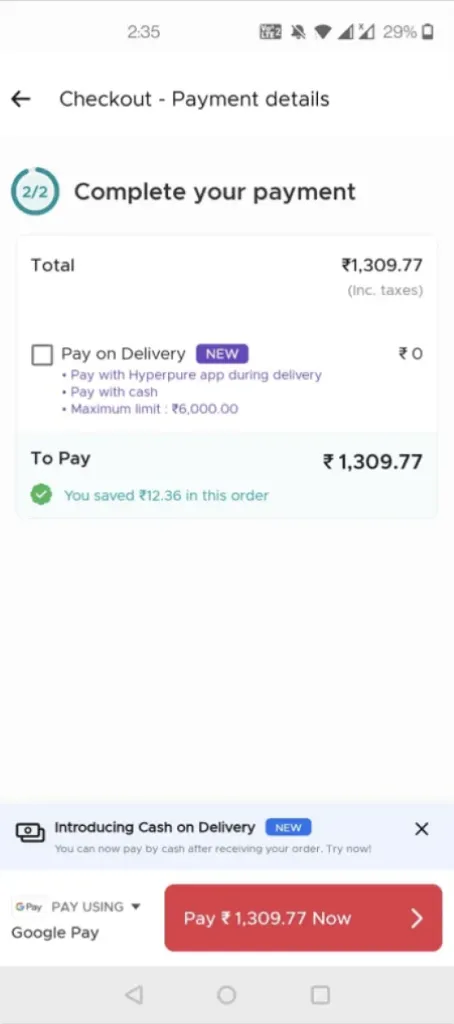 1234
- 1Focusing only on the amount to be paid with no distractions.
- 2Easy to switch payment options.
- 3Highlighting other/new features available in a subtle visual manner without confusing the user.
- 4Highlighting savings.
A checkout about paying, with savings highlighted.
Hover a highlight or a note to link them
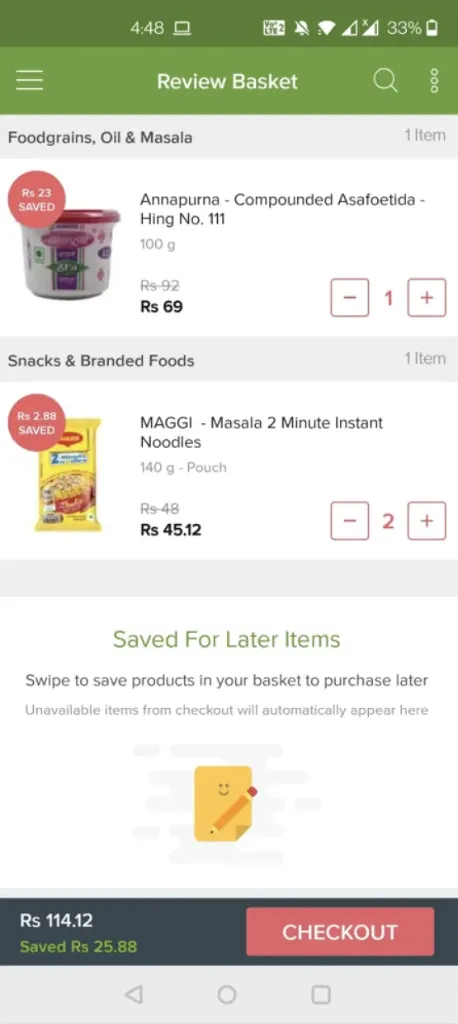 1234
- 1Segregating the categories & items in cart.
- 2Signifying the discount grabbed at each product.
- 3Instead of just basket, BigBasket calls it "Review Basket" to specify the fact of reviewing the order.
- 4Clearly representing the price to be paid and the discount availed.
Savings shown on every item, and a “review” moment before paying.
Hover a highlight or a note to link them
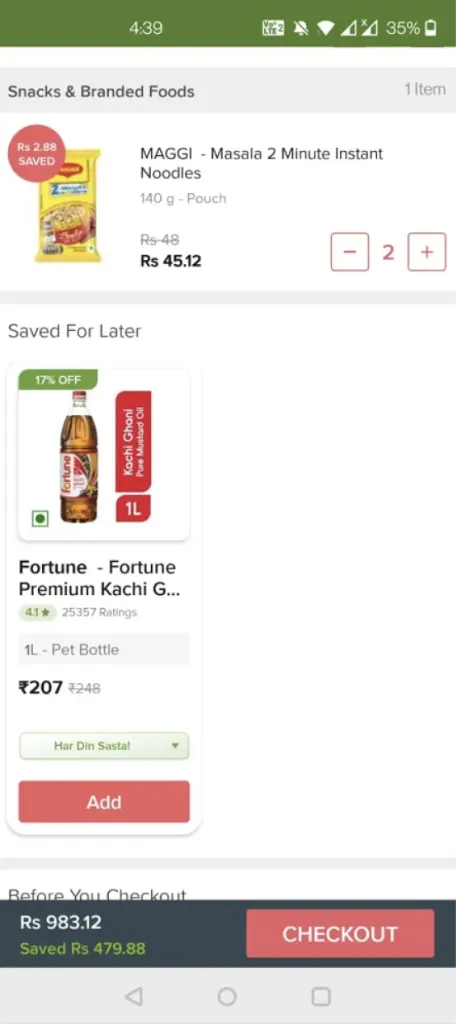 1234
- 1Towards the end of the cart there is saved for later items section which can be accessed to easily add them to the cart.
- 2Using colours in the textual information (green for amount saved, Red for Checkout) to highlight the information.
- 3Clear & Highlighted Checkout CTA is given importance to attract user’s attention.
- 4When there is an item saved for later then it can be easily added to the cart.
Colour for savings and a checkout button you can’t miss.
Hover a highlight or a note to link them
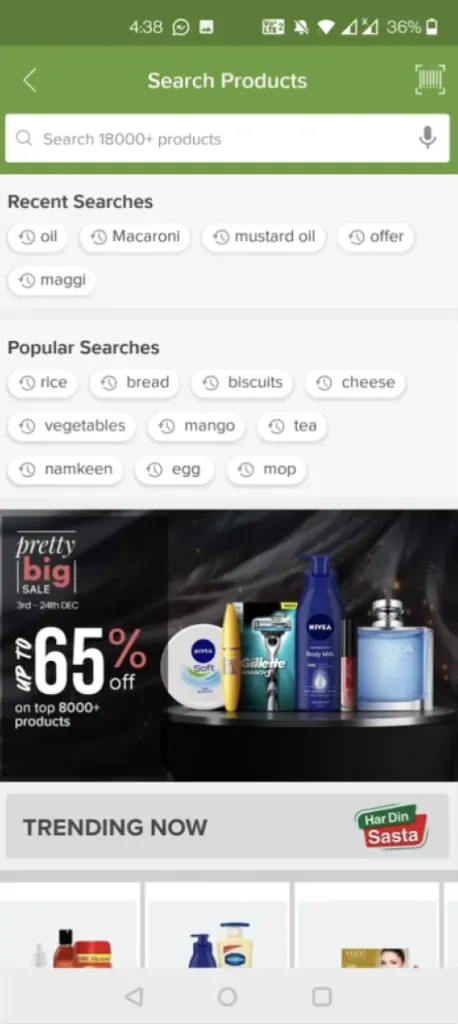 123
- 1Recent searches are clearly highlighted.
- 2Popular searches are clearly highlighted.
- 3Offers and trending products are promoted.
Recent and popular searches, plus offers.
Hover a highlight or a note to link them
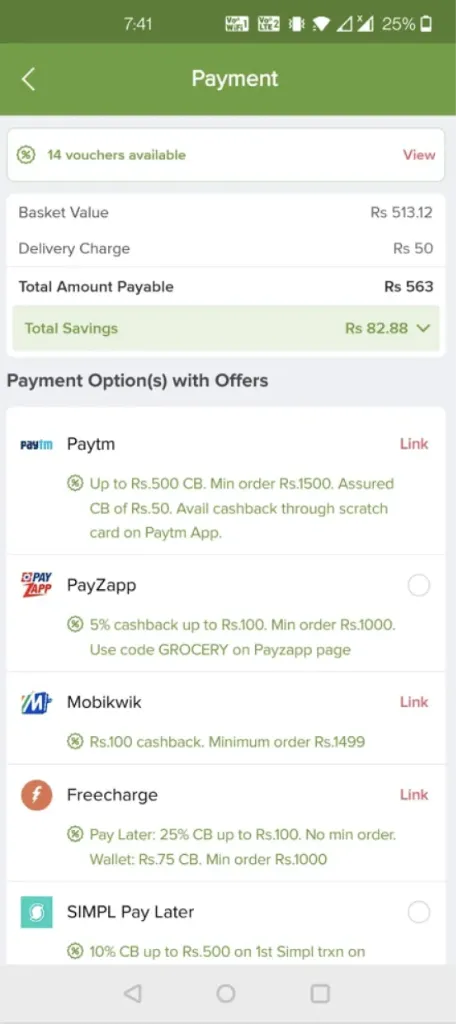 1234
- 1Highlighting Total Savings and Total Payable amount only to avoid confusion.
- 2Providing options to pay rather than showing any other option that can confuse the user.
- 3Highlighting vouchers available.
- 4Highlighting payment options with offers.
Only the total to pay and the total saved.
Hover a highlight or a note to link them
We went to their shops in Mumbai and Vadodara
With my UX researcher, we ran moderated interviews with 20 merchants in a tier 1 and a tier 2 city, to hear their needs, pain points and ideas first-hand.
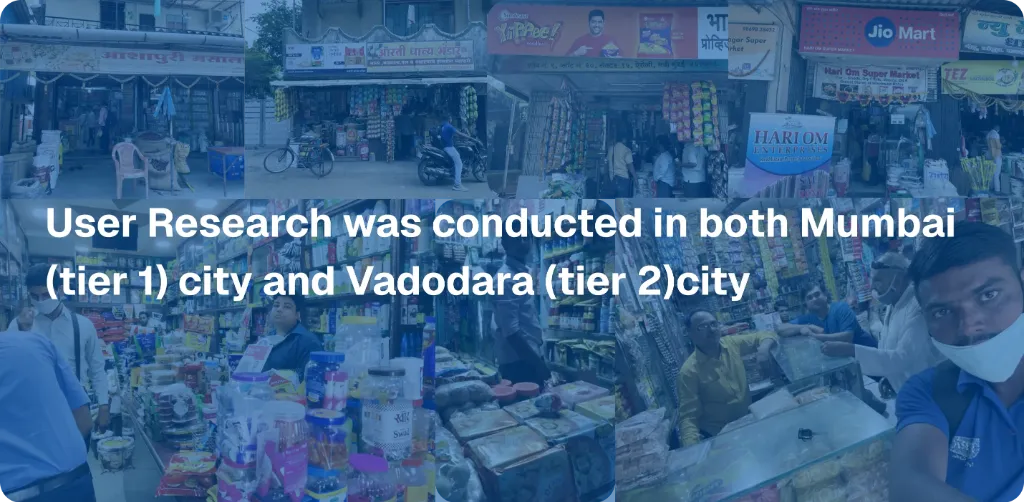
- Active merchants in urban and semi-urban areas
- At least 2 orders in the last month
- A mix of those who order themselves and those who need a sales officer’s help
- Aged 26 to 50
| Age | 26–30 | 31–35 | 36–40 | 41–45 | 46–50 |
|---|---|---|---|---|---|
| Merchants | 4 | 4 | 4 | 4 | 4 |
20 merchants · Mumbai and Vadodara
Every finding got a type and an owner, not just a design fix
Some problems were ours to design. Others needed tech or business. Tagging each one kept the redesign focused on what design could actually move.
The page is slow to load.
FixTech team to improve load time and stability.
Search needs to be more robust and easier to use.
FixShow recent searches, suggestions and offers while searching; improve the algorithm and drop irrelevant results.
Limited product variety causes drop-offs after browsing.
FixBusiness team to add wanted products and improve availability.
Not showing the net amount to pay causes drop-offs after browsing.
FixShow the net amount to pay on the PLP as soon as a product is added, including auto-applied coupons and schemes.
Competitors offer better prices.
FixBusiness team to sharpen prices and offers; design to show them better.
The PLP feels cluttered.
FixDeclutter the PLP.
Discounts and margins aren’t clear.
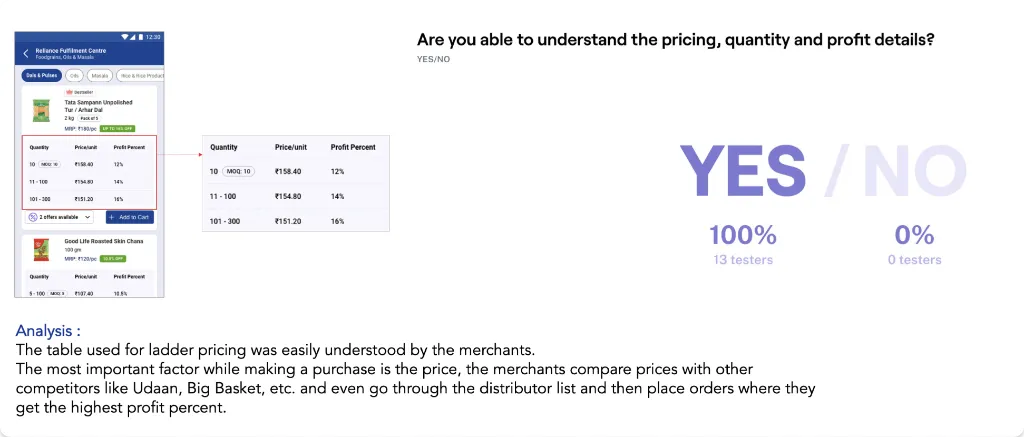
FixLadder pricing to show quantity tiers and the discount at each.
Competitors offer better prices.
FixBusiness team to sharpen prices and offers; design to show them better.
Useful recommendations can grow the order
FixSuggest bestsellers in the cart that are easy to add and grow the order.
Highlighted savings nudge merchants towards checkout.
FixHighlight the amount saved, which is the merchant’s margin; business to improve margins.
Key details in the cart aren’t prioritised.
FixPrioritise savings, delivery date and shipment details visually.
Relevant coupons aren’t suggested.
FixHighlight applicable coupons and make them easy to apply.
Cart items are hard to change.
FixClear edit buttons and an obviously editable quantity.
Only what’s needed, no distractions, while paying.
FixOnly payment information at checkout; everything else is settled earlier.
Highlighted savings nudge merchants to pay.
FixHighlight the amount saved, which is the merchant’s margin.
Payment options aren’t clear.
FixShow only the total, payment options and payment-related items like wallet balance and savings, so nothing distracts.
Cluttered UI and misleading paths.
FixA clear, focused payment UI.
Then we sketched, starting from how merchants already work
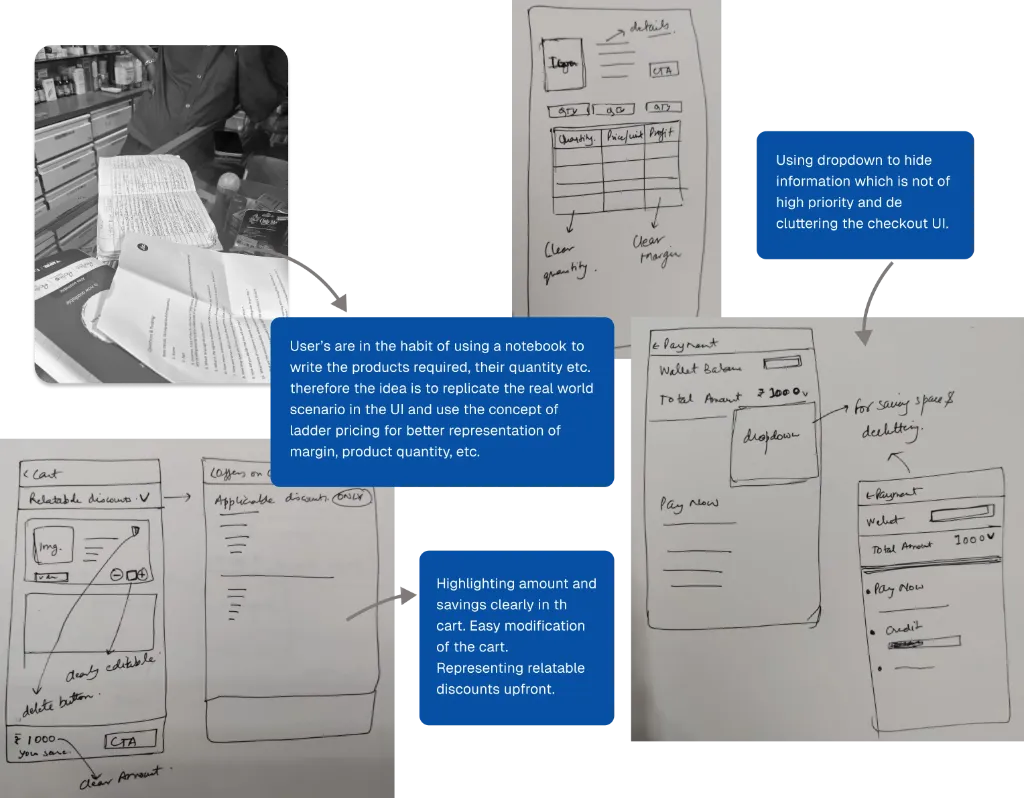
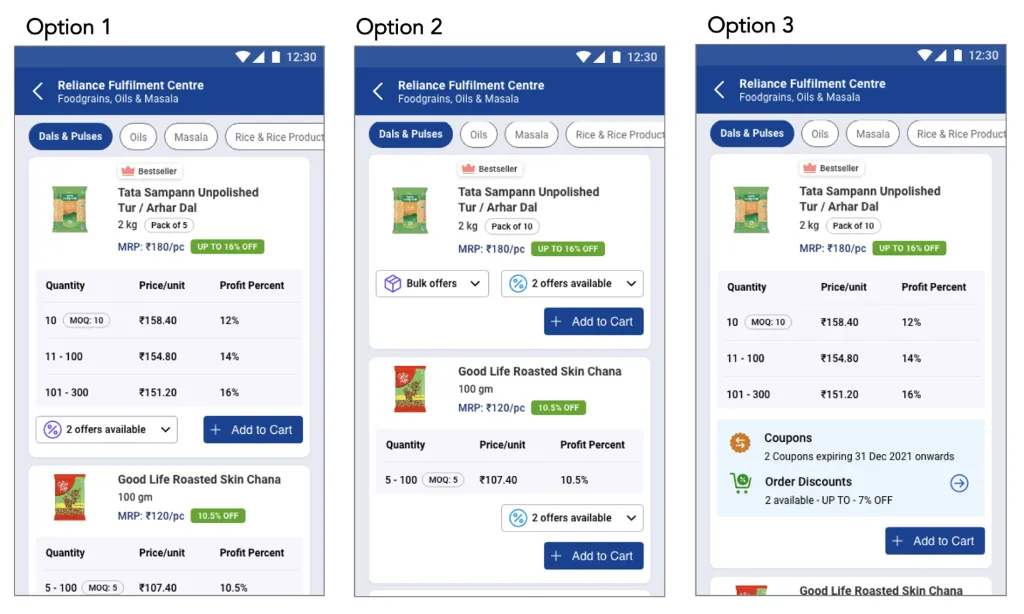
Merchants work out bulk orders in notebooks. A ladder pricing table shows quantity tiers, unit price and margin the same way.
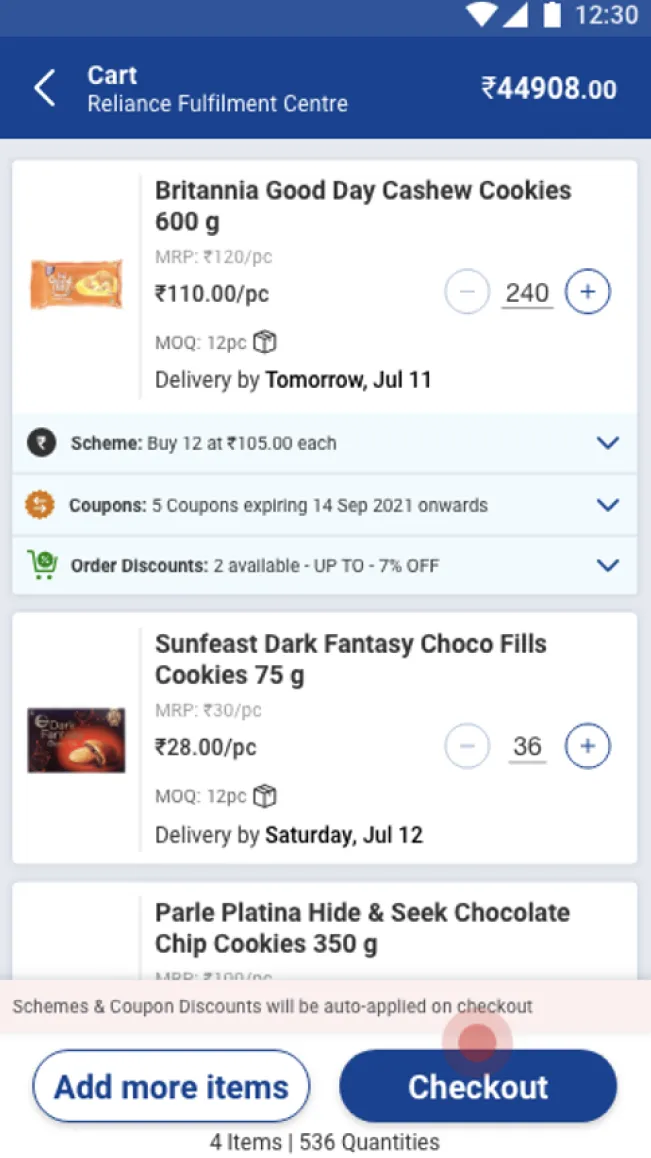
Price breakups collapse into a dropdown, so the payment is the only thing competing for attention.
Net savings and margin in the sticky cart footer, with quantities easy to change inline.
An impact × effort matrix decided what went first
Each idea was scored on impact (for the merchant, the business and the product) and effort (design, tech and business time), so we could ship the quick wins first.
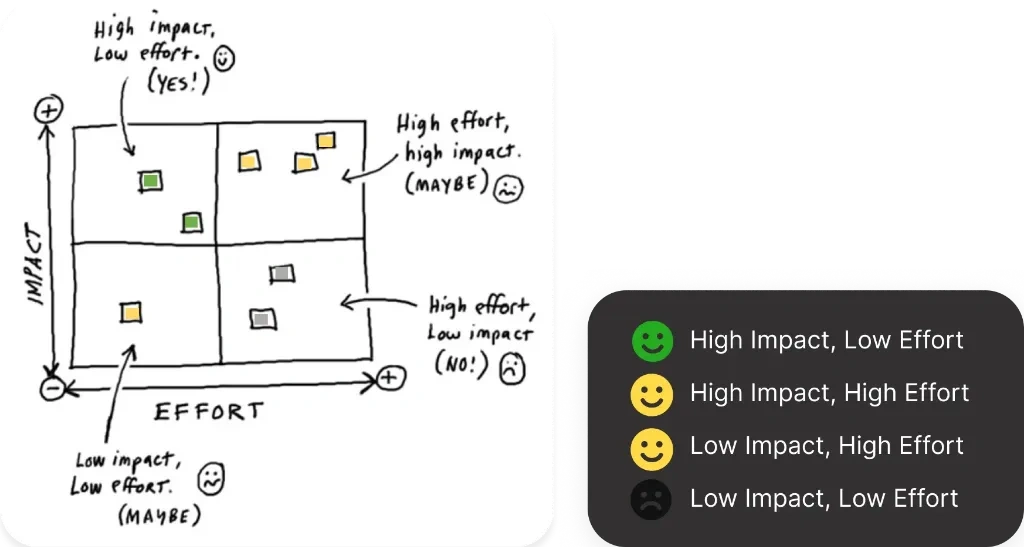
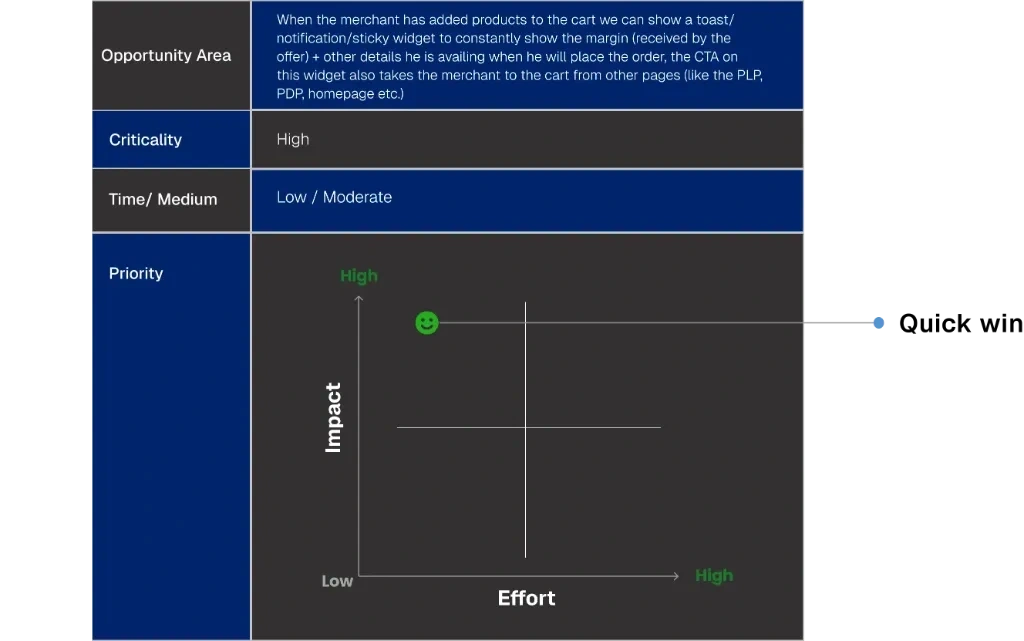
Priority weighed three things: criticality (benefit to merchant, business and product), how it’s built (design, tech, business or a mix), and time to ship.
Help merchants find what they reorder, fast
Most orders start with Browse or Search, so search now shows recent and popular searches, categories and offers before a merchant types a word.
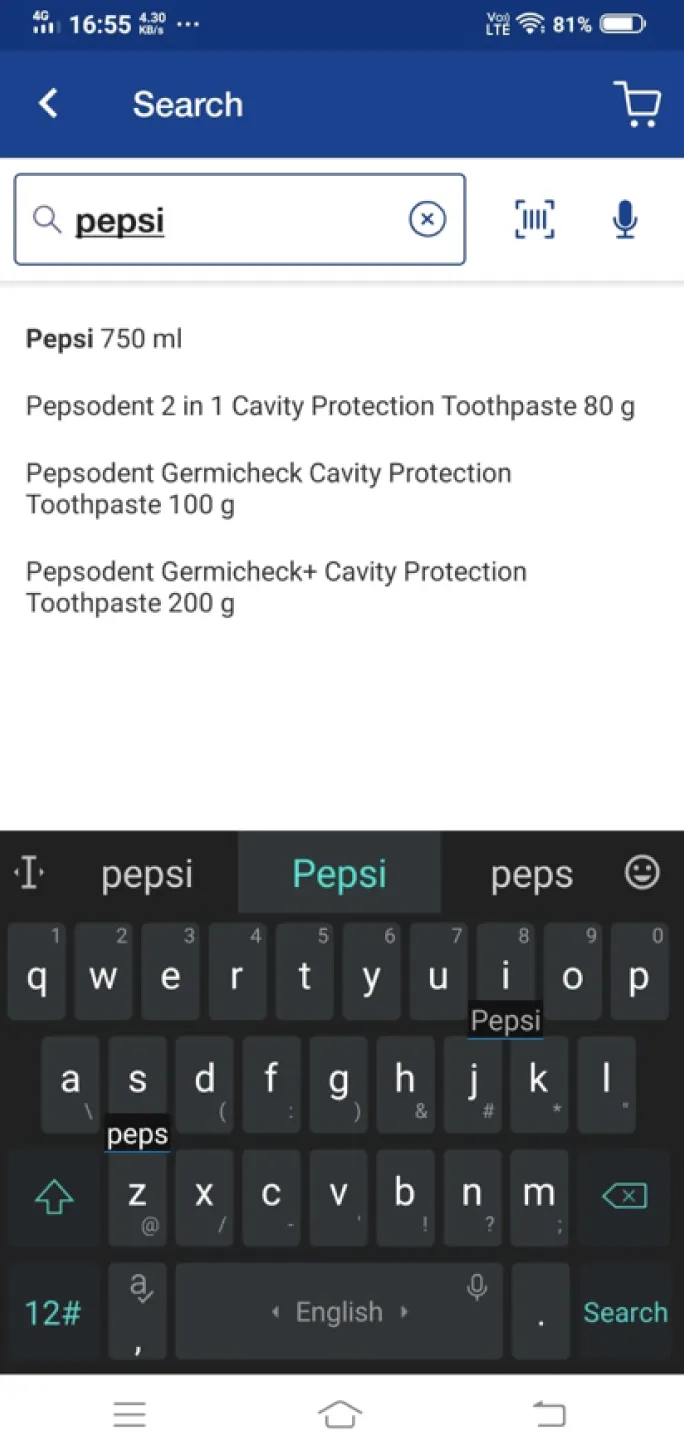
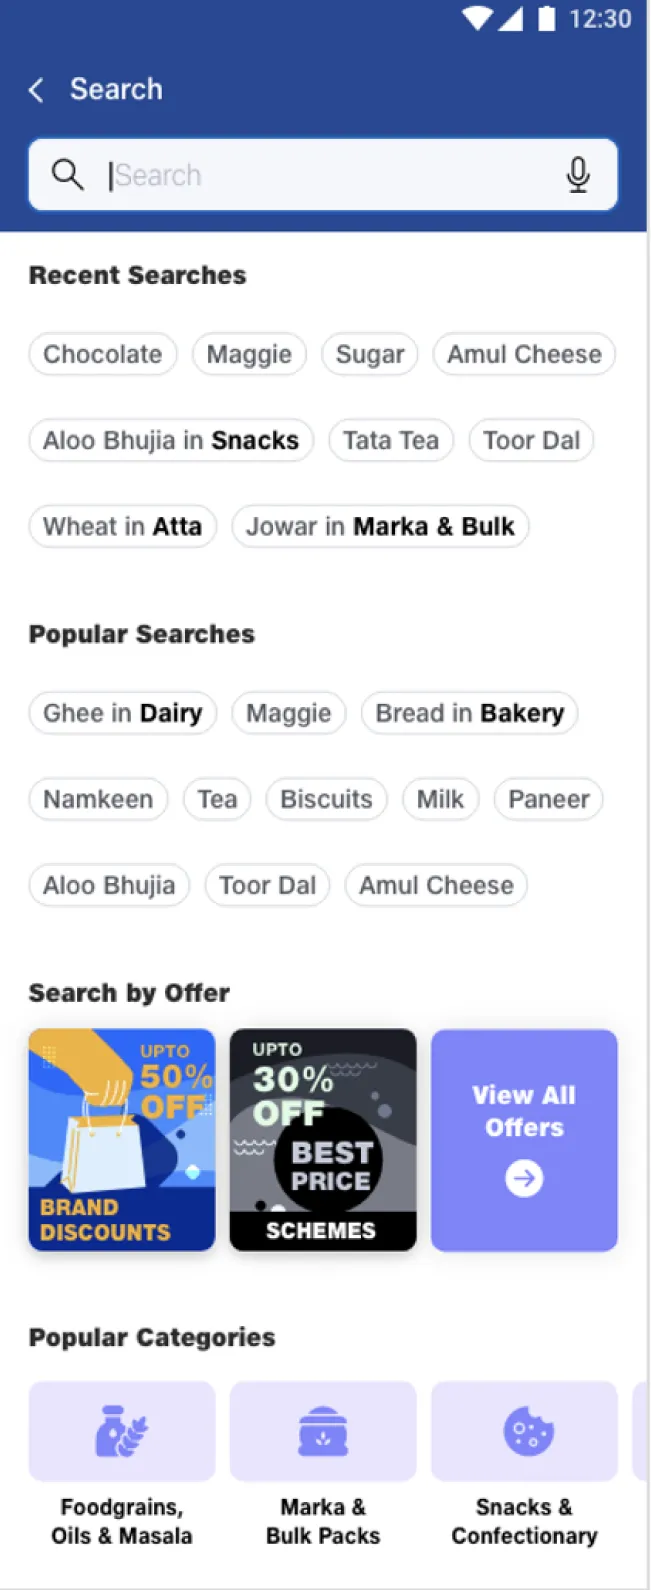
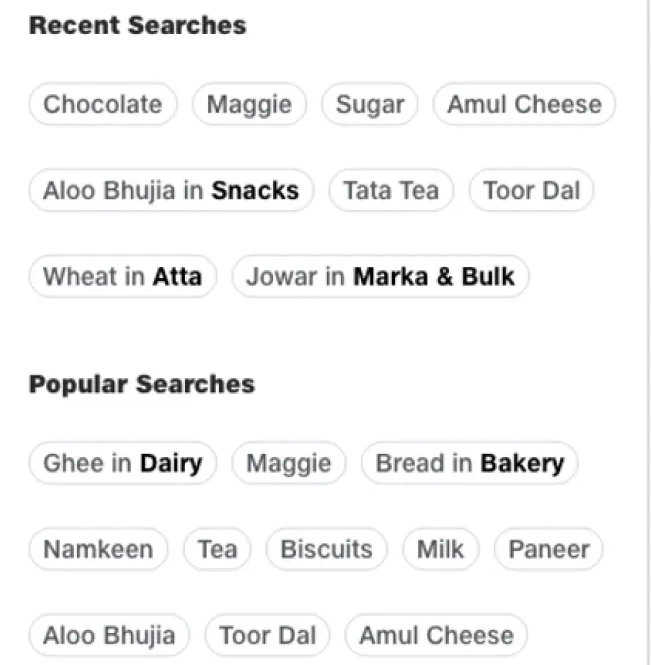
- Recent searches are highlighted while searching.
- Popular searches are highlighted while searching.
- Category wise search categories are also represented.
- Offers are also highlighted while searching.
Show the margin where the decision happens
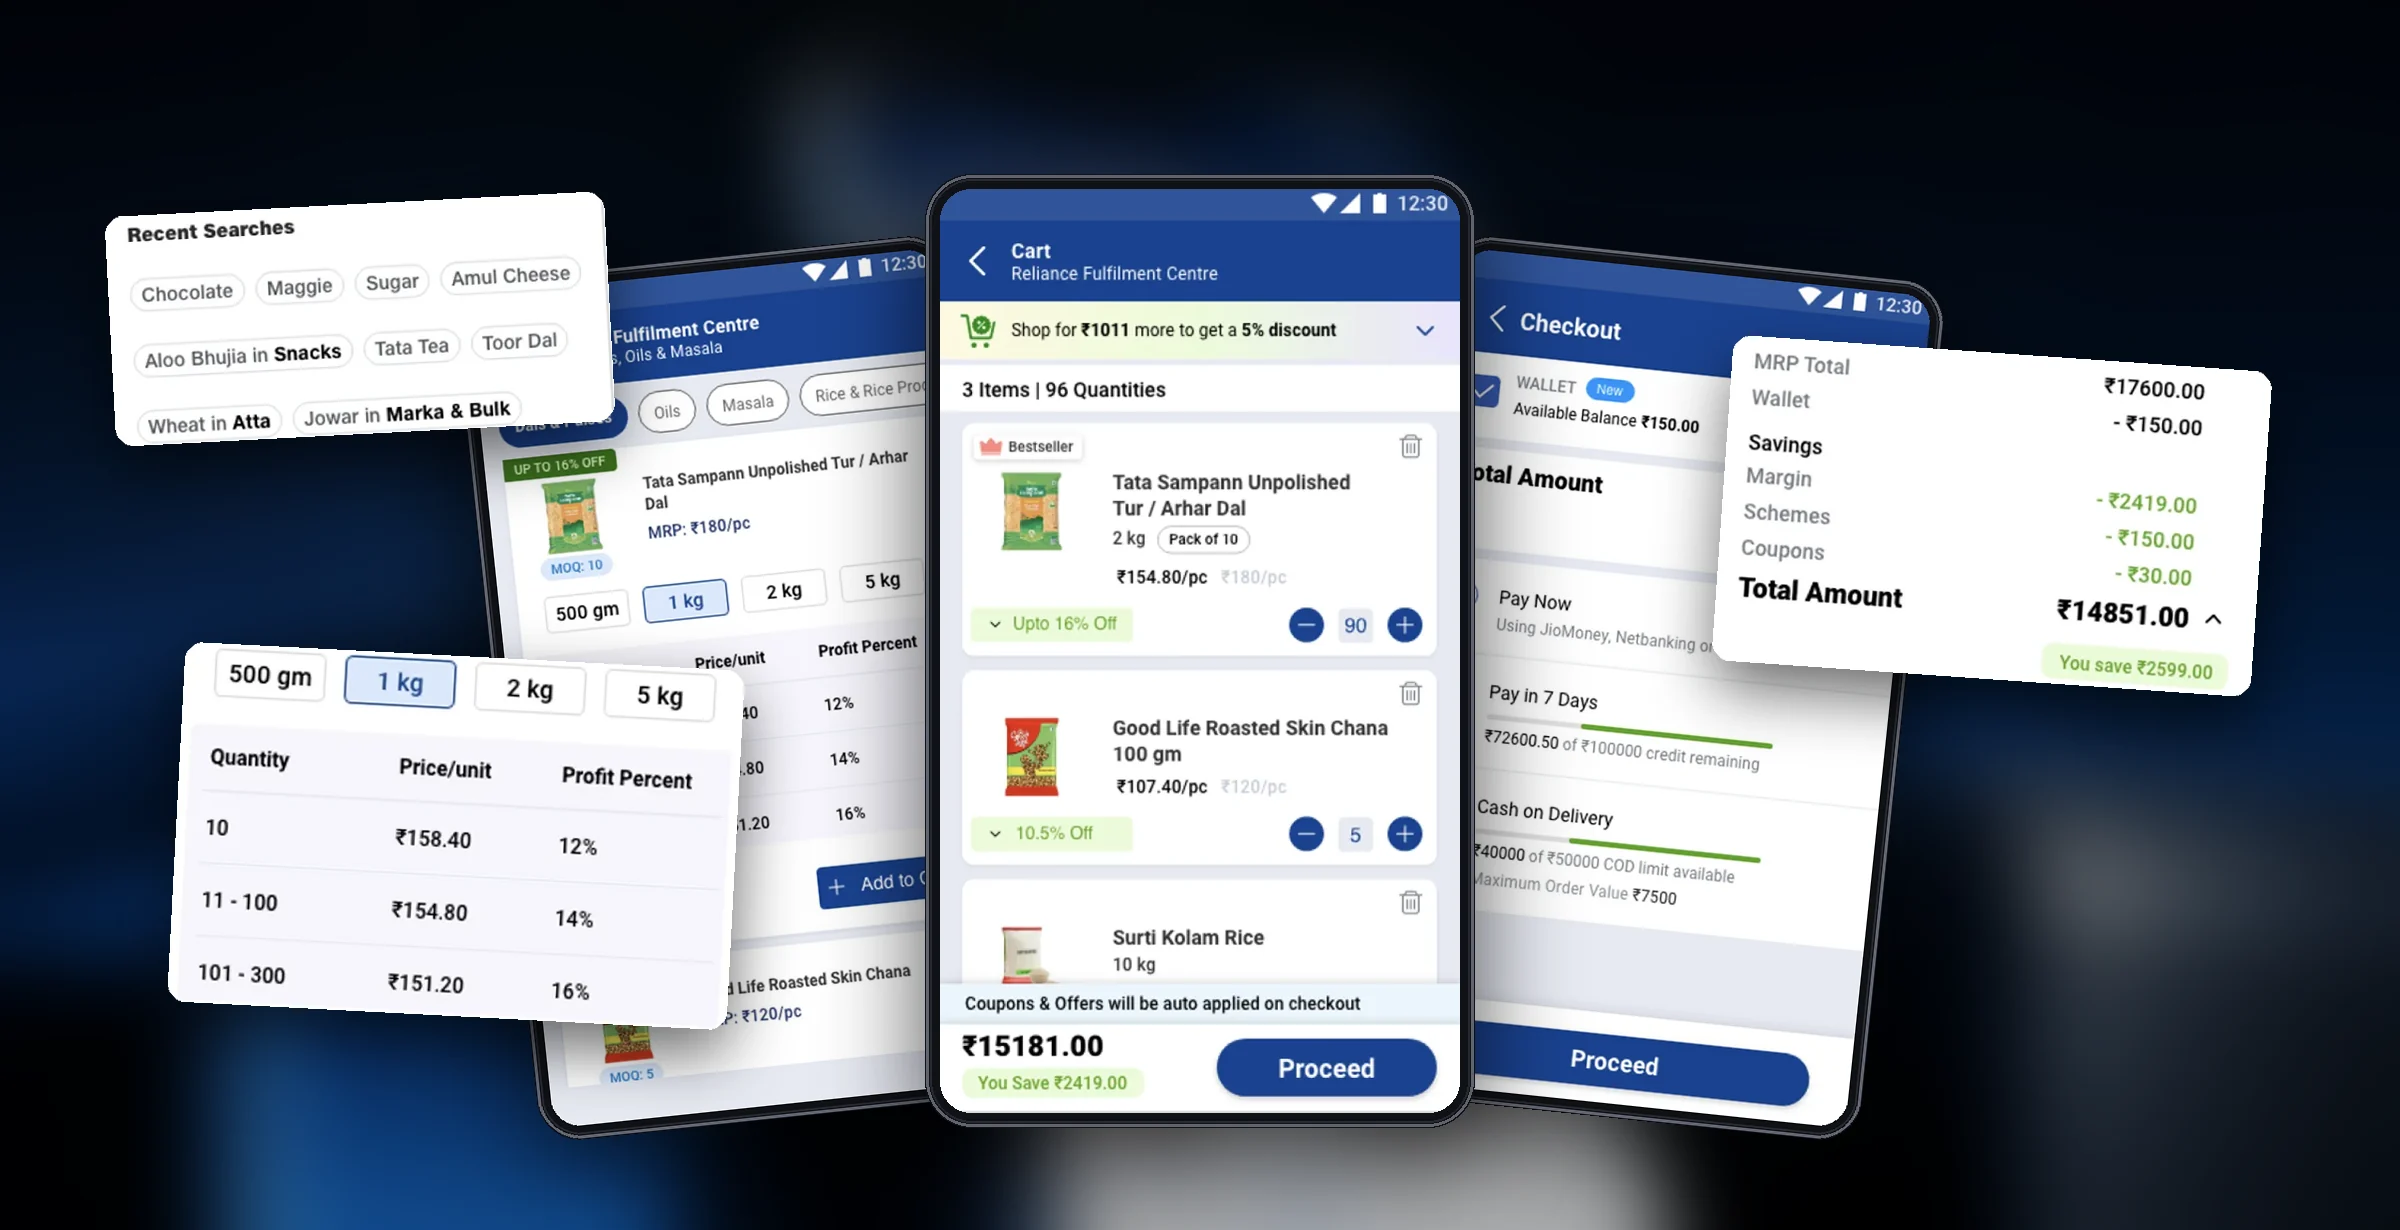
The idea from the ledger notebooks: a ladder pricing table with quantity, price per unit and profit percent, right on the card. Variants are easy to pick, the card is decluttered, and the call to action is clear.
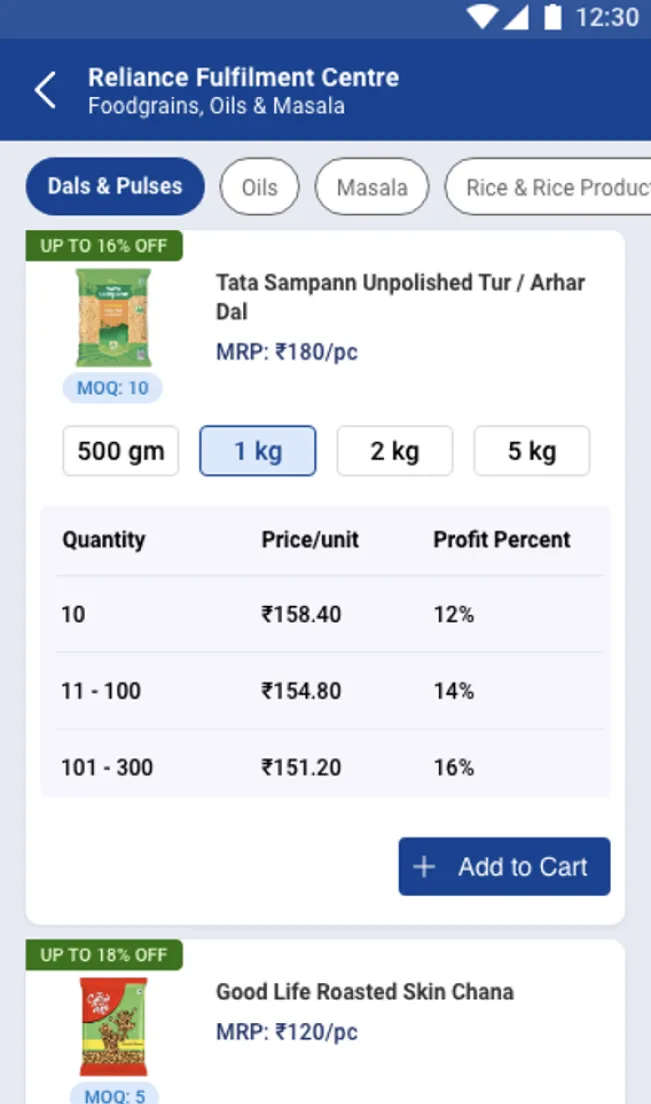
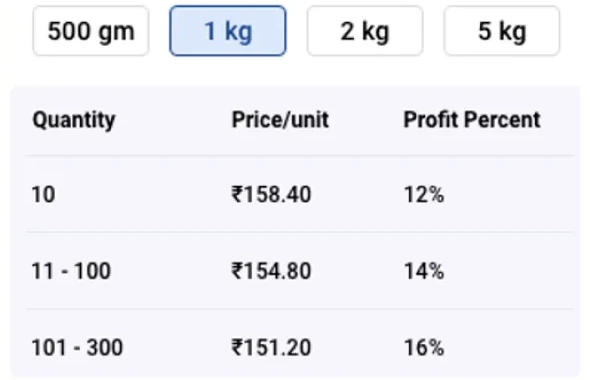
- Easy to select desired variant.
- Mentioning profit percentage clearly and using the concept of ladder pricing to help in decision making.
- Clear CTA.
- Decluttered product card.
Try it: how the ladder picks your price
Change the quantity and watch the tier, unit price and profit update.
| Quantity | Price / unit | Profit |
|---|---|---|
| 10 | ₹158.40 | 12% |
| 11 – 100 | ₹154.80 | 14% |
| 101 – 300 | ₹151.20 | 16% |
This is the point of the dense table: merchants buy on margin. Showing the next tier, and exactly how far away it is, turns the table into a decision, not just more information on the card.
Make the savings impossible to miss
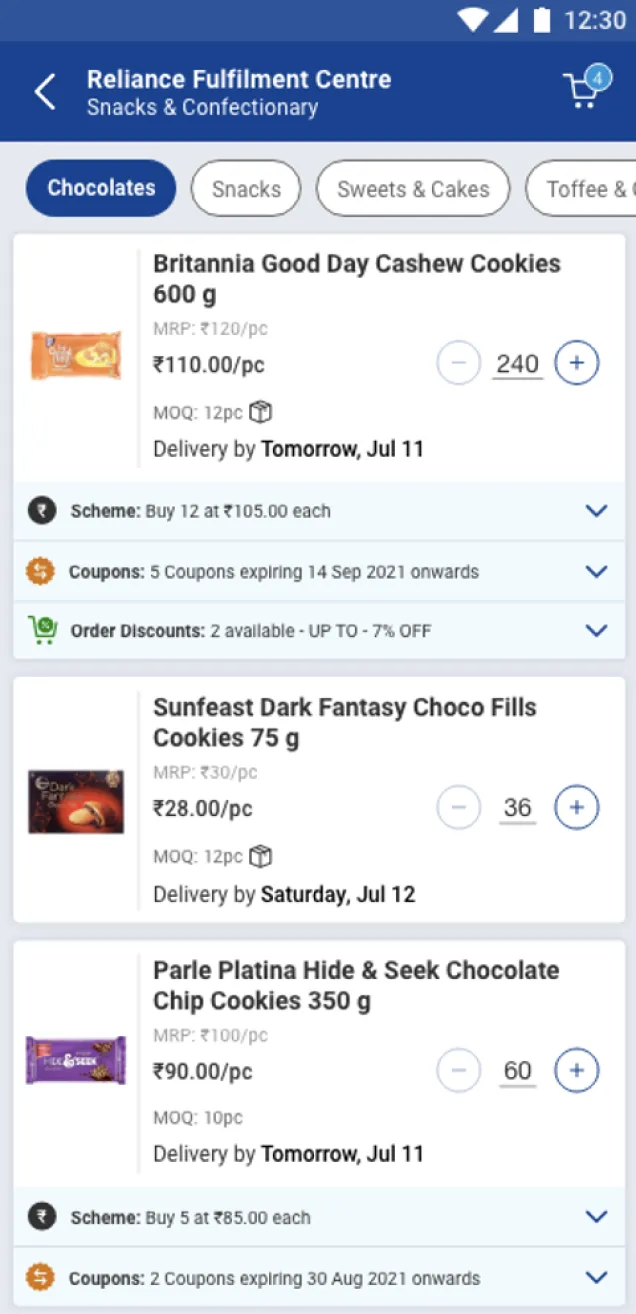
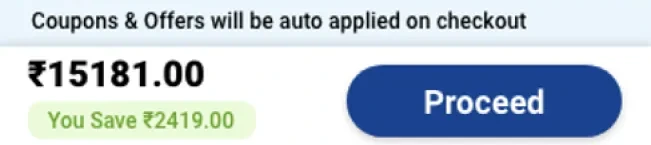
The cart now shows only relevant discounts, the total items, easy delete and clear − and + controls, and puts the amount and what you save in the footer, next to Proceed.
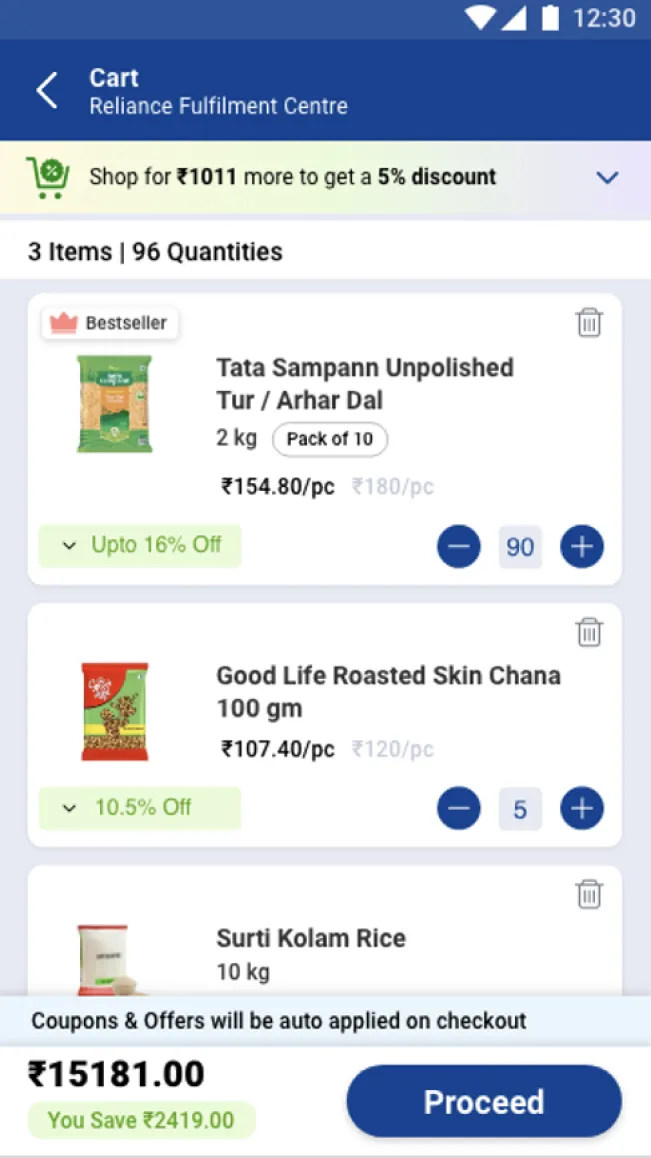
- Representing only relatable discounts.
- Representing total number of items clearly.
- Deleting an element easily from cart.
- Clear "-" & "+" buttons and clearly editable quantity of the product.
- Signifying the auto applied coupons/savings availed clearly.
- Representing Cart Amount clearly.
Only the amount, the savings and how to pay
Checkout focuses on the amount to pay, what you save and the payment options. The full breakup is still there, one tap away in a dropdown, instead of on separate pages.
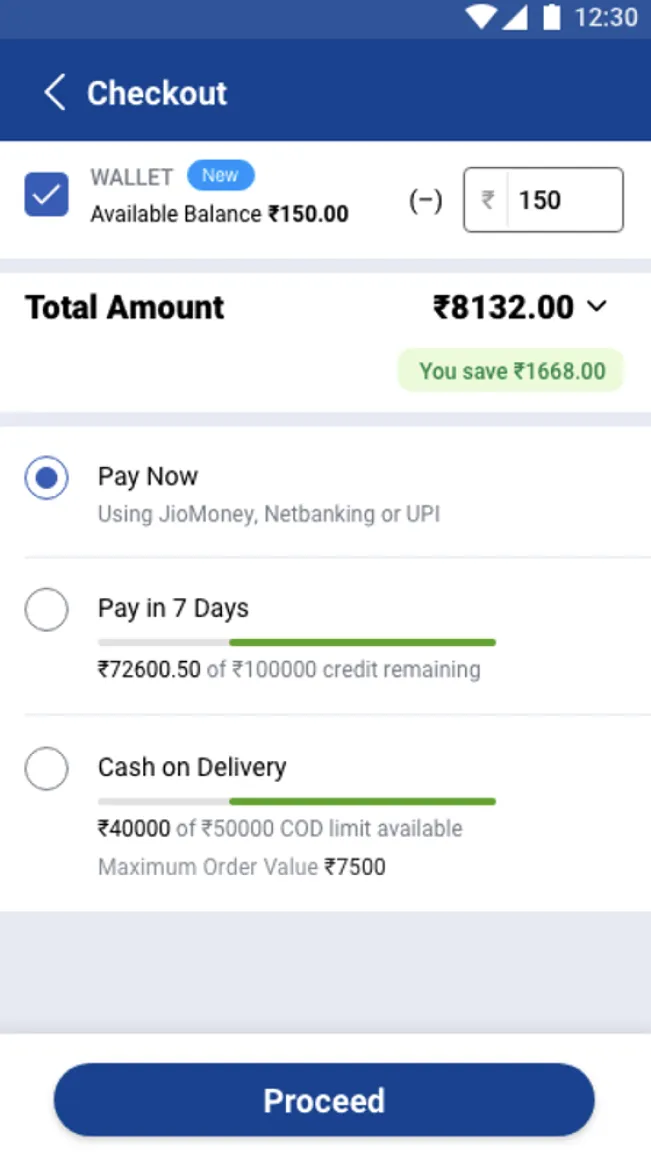

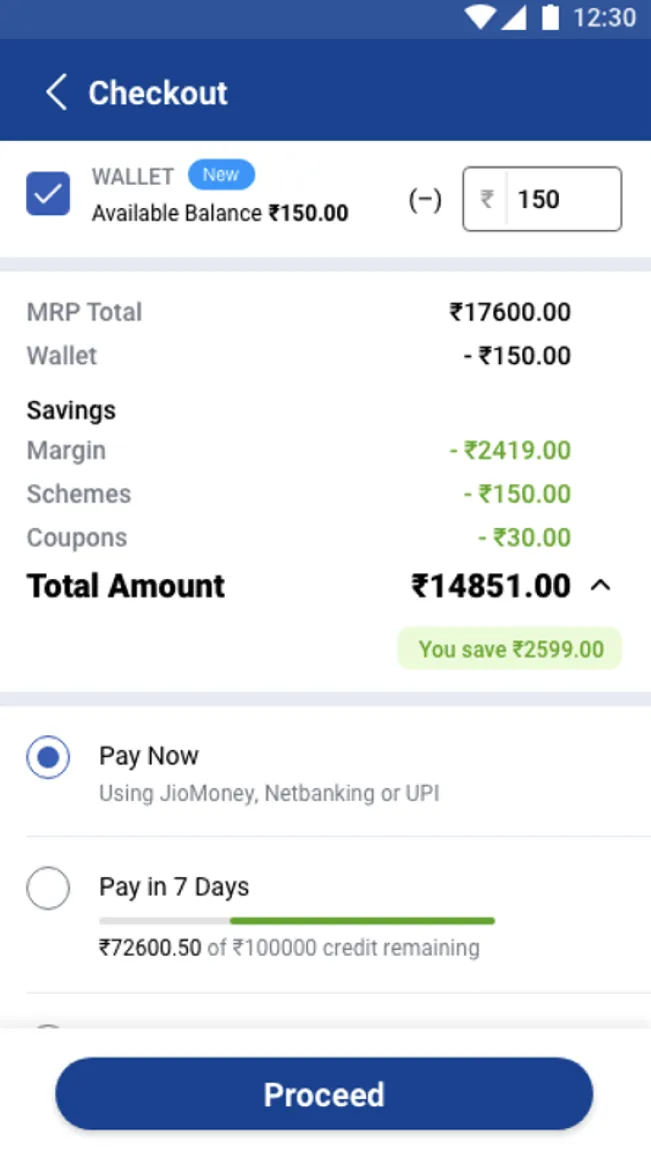
- Decluttering the checkout page and only highlighting the amount to be paid and the savings to limit any distraction.
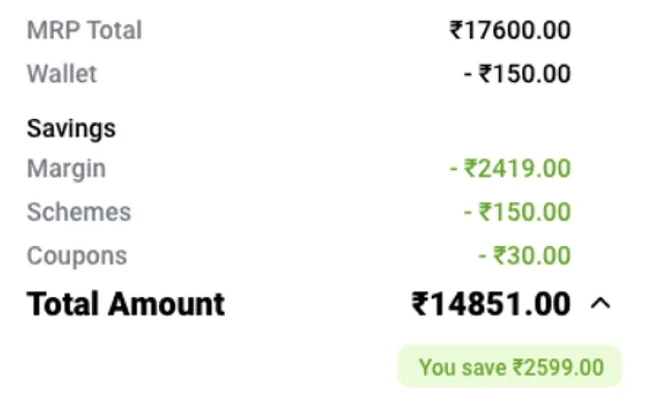
- There is a dropdown in case the user wants to see the calculation, but the focus is on the amount to be paid, savings (to add a delightful element) and the payment options to complete the payment.
- Dropdown can be accessed when required to see the break-up details.
We tested three ladder-pricing designs with merchants before build
Before development, we ran multivariate tests, unmoderated on Maze plus in-person sessions to see which product listing design merchants found easiest.
Scope, method and script, with Maze as the testing tool.
Clear tasks, self-reported UX metrics and recruited merchants.
A test report, observation, interviews and merchant insights.
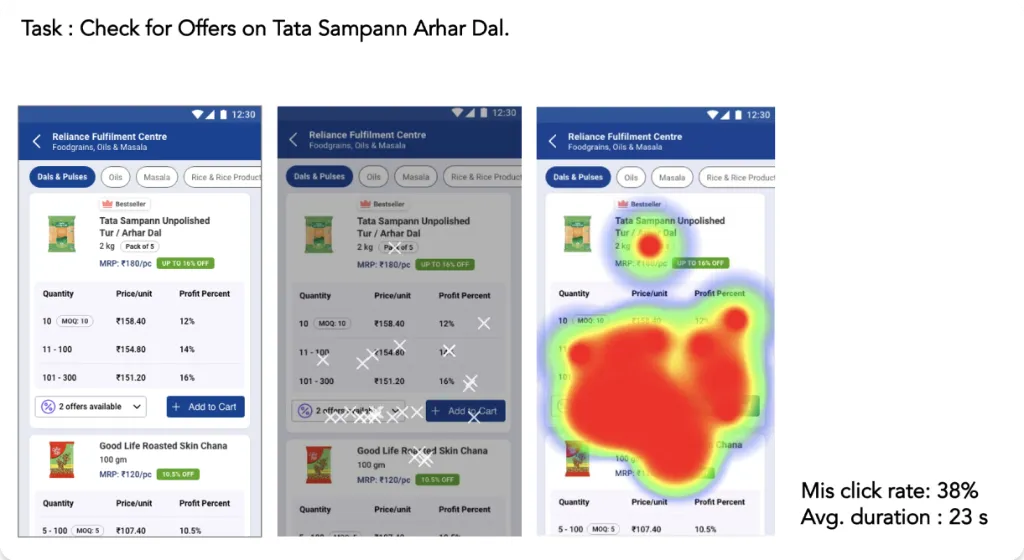
- Find offers on the product listing
- Find bulk offers when ladder pricing wasn’t shown upfront
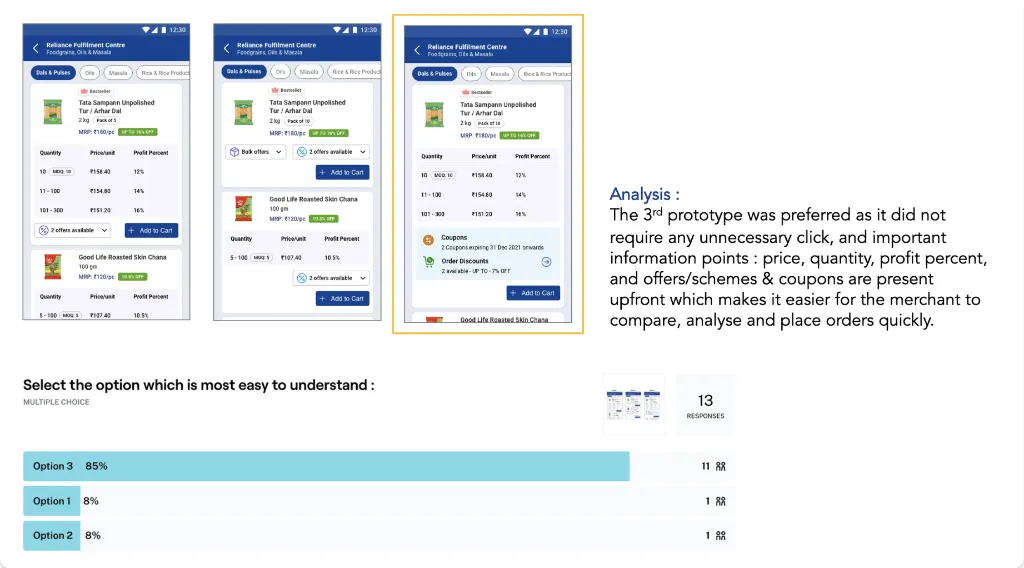
- Pick the ladder pricing design that’s easiest to understand
| Age | 26–30 | 31–35 | 36–40 | 41–45 | 46–50 |
|---|---|---|---|---|---|
| Merchants | 2 | 2 | 2 | 2 | 2 |
Screener above: 10 merchants by age · 13 merchants in total completed the Maze test · Mumbai and Vadodara
Mis-click rate when offers were hidden, avg. 23 seconds to find them
merchants (85%) picked Option 3: price, quantity, profit and offers all upfront, no extra taps
merchants understood the ladder-pricing model: price, quantity and profit
Daily orders nearly doubled in three quarters
We met the design deadline, so the redesign shipped on time. We tracked the same KPIs from before the work began.
Average daily orders, 56,267 → 1,09,797
Part of this came from more daily visits and a growing merchant base over the same quarters, so it isn't all down to the redesign.Orders per daily visit
Out of every 100 daily visits, 46 now end in an order instead of 35. Because it's measured per visit, more traffic can't inflate it. It's the clearest evidence that the redesigned journey converts better.Average daily orders
Per quarter, FY 2021–22 to FY 2022–23
| Data points | Q4 21–22 | Q1 22–23 | Q2 22–23 | Q3 22–23 |
|---|---|---|---|---|
| Avg. daily visits | 1,58,666 | 2,04,150 | 2,41,999 | 2,38,920 |
| Avg. daily orders | 56,267 | 69,442 | 82,107 | 1,09,797 |
| Orders per daily visit | 35% | 34% | 34% | 46% |
 OneCard·FinTech / Travel
Helping Drive 2.2× Flight Booking Conversion by Building a Scalable Travel Ecosystem
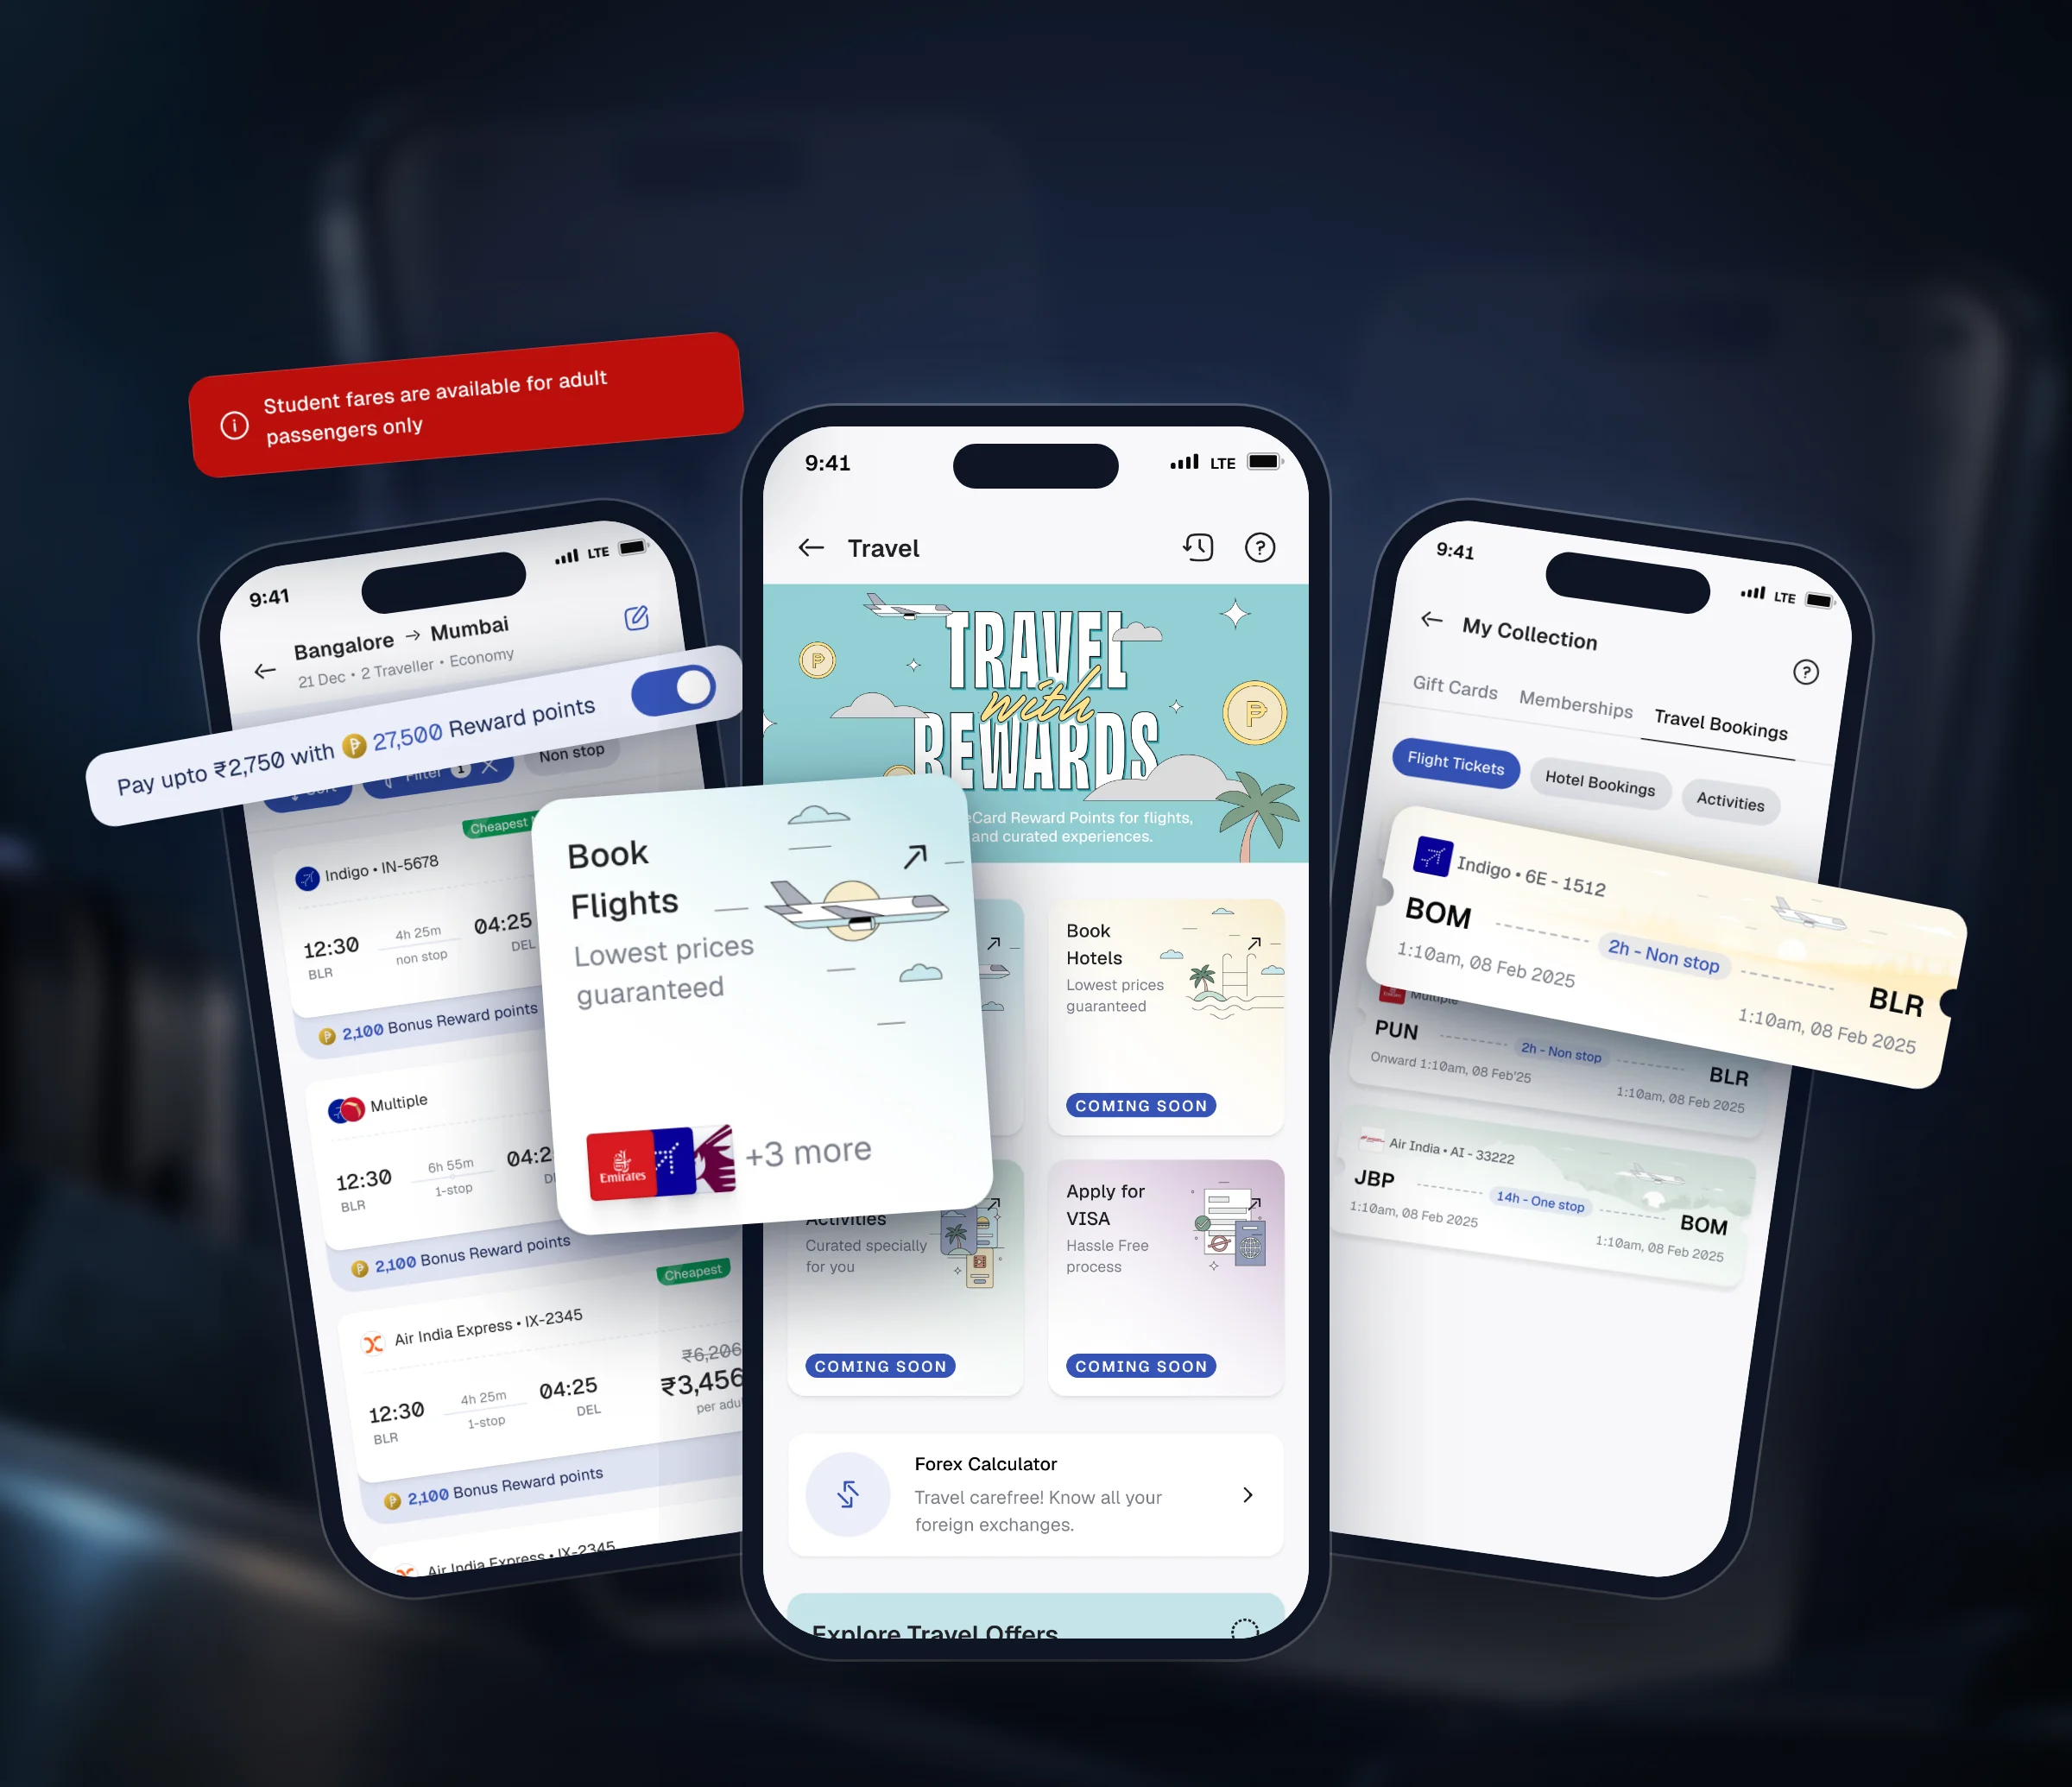
Led end-to-end design for native flight booking on a partner engine, with reward points as the reason to book with us.